Fractal Dimension Weierstrass-Mandelbrot
“Fractal Dimension Weierstrass-Mandelbrot” is a computer programme for generating values with a given fractal dimension and calculating the fractal dimension of time series based on the developed method.
The simplified Weierstrass-Mandelbrot cosine fractal function is used as a fractal function.
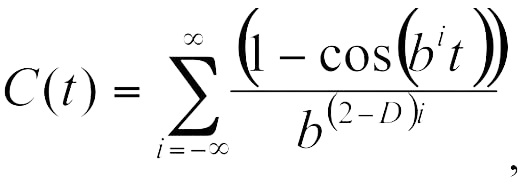
where D – is an analogue of the fractal dimension, b – coefficient (Mandelbrot B.B. The Fractal Geometry of Nature. W.H.Freeman, New York, 1982; Feder E. Fractals. New York: Plenum Press; 1988).
The calculation algorithm is based on the macros of the Visual Basic programming language.
Step by step calculation:
- 1. Set n – the number of generated values.
- 2. Set D – the value of the fractal dimension (1<D<2).
- 3. Set b – coefficient.
- 4. By pressing the “Calculation of Weierstrass Function” button, the values of the Weierstrass-Mandelbrot function С(t) and С(t) normalised are calculated. In the program, the sum index changes in the range -100≤i≤100.
- 5. By pressing the buttons “Fractal Dimension” and “Fractal Dimension (averaged)”, the values of k, L and k aver and L aver are calculated for normalised C(t) data.
Calculation results are presented on the charts (“InputData” page) and on the “Fractal Dimension” and “Fractal Dimension(averaged)” pages.
For large values of k and kaver , the dependencies Log(L)-Log(k) and Log(Laver )-Log(kaver ) lie on a straight line, the slope of which determines the values D (Fractal Dimension), D averaged (Fractal Dimension (averaged) ), coefficients A and A averaged (the range of straightening is selected in the corresponding cells).
To analyse the time series, you can use the value of the coefficient of variation (volatility) l (InputData page)
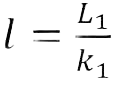
In this program, the value of (the number of differences between the neighbouring measurements) is not considered, but is determined from the equation

where – is the number of measurements, – the measurement step (interval between measurements).
For the averaged case

References
1. Suleymanov A.A., Abbasov A.A., Ismaylov A.J. Application of fractal analysis of time series in oil and gas production. Petroleum Science and Technology, 2009, Volume 27, Issue 9, 915-922. DOI:10.1080/10916460802455608.
2. Suleymanov A.A., Abbasov A.A., Malikov H.Kh. Fractal analysis of time series in oil and gas production. Chaos, Solitons and Fractals, 2009, Volume 41, Issue 5, pp. 2474-2483. DOI:10.1016/j.chaos.2008.09.039.
3. Suleymanov A.A., Abbasov A.A. Diagnosis of well production operations on the basis of nonparametric criteria of production data variations. Petroleum Science and Technology, 2011, Volume 29, Issue 22, pp. 2377-2383. DOI:10.1080/10916461003716673.
4. Suleymanov A.A., Abbasov A.A. About some criterion on the state of oil and gas production process diagnostics. SOCAR Proceedings, Issue 2, 2010, 42-49. DOI: 10.5510/OGP20100200020.
5. Suleymanov A.A., Abbasov A.A. et al. Fractal Analysis of Chaotic Fluctuations in Oil Production. Advances in Intelligent Systems and Computing, Springer Nature Switzerland AG 2019, 484-490. https://doi.org/10.1007/978-3-030-04164-9.